Today we’re going to talk about canvases, with a particular focus on how to squeeze as much value as possible out of them if you’re a business analyst. We’ll touch on the Business Model Canvas, Lean Canvas, Feature Canvas, Value Proposition Canvas, and even come up with our own Canvas. We’ll see that all canvases are conceptually similar — you just need to understand how to cook them properly, while the semantic variations are not that significant.
Where did they come from in the first place? A bit of archaeology tells us the following.
The ideas behind the first canvas (Business Model Canvas) were introduced in the book Business Model Generation (Alexander Osterwalder, Yves Pigneur), where the authors identified nine key elements of any business model and showed how to describe them on a single page. And to do it in a way that is simple, fast, visual, and collaborative. It’s easy to notice that these are exactly the principles underlying all canvases.
We won’t go into a detailed breakdown of the BMC with all the nuances and block-by-block advice from the authors, because this canvas is easy to google. However, we will list the blocks:
Where did they come from in the first place? A bit of archaeology tells us the following.
The ideas behind the first canvas (Business Model Canvas) were introduced in the book Business Model Generation (Alexander Osterwalder, Yves Pigneur), where the authors identified nine key elements of any business model and showed how to describe them on a single page. And to do it in a way that is simple, fast, visual, and collaborative. It’s easy to notice that these are exactly the principles underlying all canvases.
We won’t go into a detailed breakdown of the BMC with all the nuances and block-by-block advice from the authors, because this canvas is easy to google. However, we will list the blocks:
- Customer Segments — customers for whom the company creates value.
- Value Propositions — the products and services into which the company embeds that value.
- Channels — how we deliver value to customers.
- Customer Relationships — how we maintain relationships with customers.
- Revenue Streams — sources of income.
- Key Resources — the company’s key assets.
- Key Activities — the main actions/processes required to implement the model.
- Key Partnerships — partners and suppliers.
- Cost Structure — expense categories.
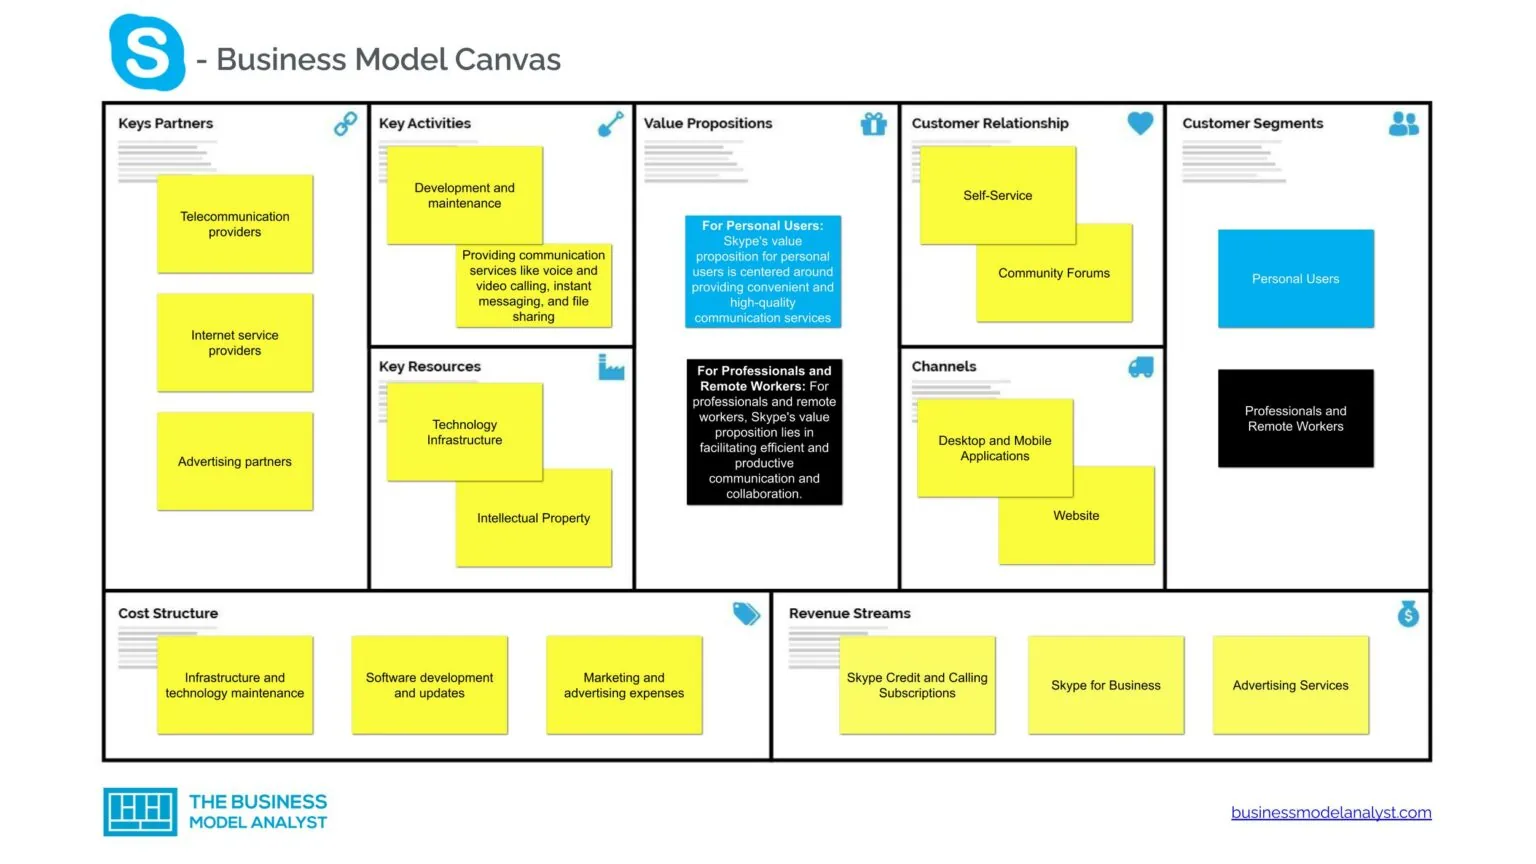
The visual nature of canvases was already baked in at this point: the authors recommended using a board, sticking notes on it, and generally treating the canvas as a living artifact for collaborative work.
In 2010, Ash Maurya created the Lean Canvas based on the BMC. The original idea was to apply the concept of a visual one-page canvas to startup product development (while preserving speed, simplicity, and visual collaboration). Naturally, the sections became somewhat different:
In 2010, Ash Maurya created the Lean Canvas based on the BMC. The original idea was to apply the concept of a visual one-page canvas to startup product development (while preserving speed, simplicity, and visual collaboration). Naturally, the sections became somewhat different:
- Problem — customer problems that we solve. You can also add Existing Alternatives — how people currently solve these problems.
- Customer Segments — customer segments. You can also also include Early Adopters — segments actively looking for solutions and willing to try something new.
- Unique Value Proposition — what is unique about the value the startup is ready to offer customers.
- Solution — solutions for each problem.
- Channels — customer acquisition channels.
- Revenue Streams — how we will make money.
- Cost Structure — cost categories.
- Key Metrics — metrics that will help measure product success.
- Unfair Advantage — things that competitors will find difficult to copy.
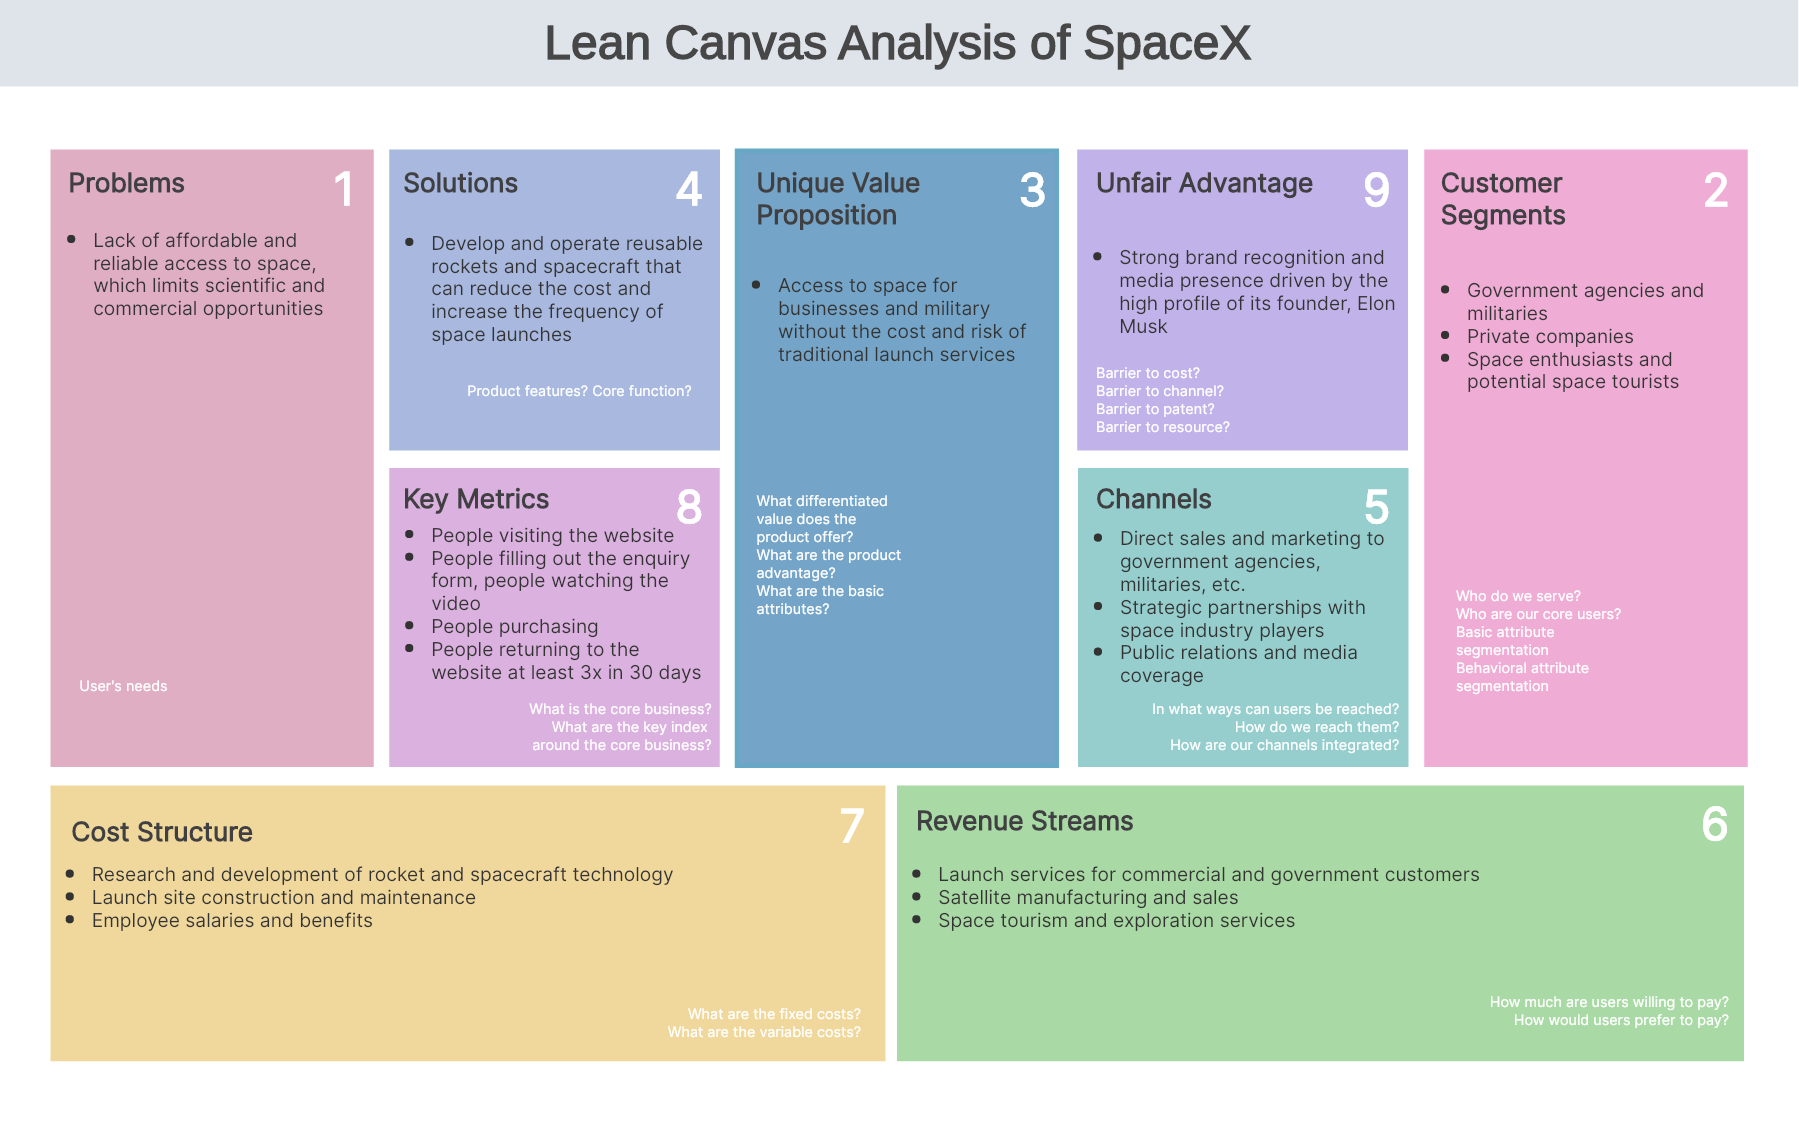
What about the out-of-the-box applicability of these two canvases for IT analysts?
In my view and based on personal experience, the Business Model Canvas is not very often useful for an IT analyst. In some situations where the business model needs to be understood (for example, we have absolutely no clue how the client’s company operates and we need to study it to better understand the context for the target solution), it can make sense to fill it out together with the client to understand their organization. Similarly, if the stars align in such a way that we are implementing a product for a client that will significantly affect how the organization operates (for example, the organization will be built around that product), and we are the analysts allowed to actively participate at that level of strategy, then we can create a similar canvas for the TO BE situation as well.
The Lean Canvas in its original form is also not always useful for an analyst — specifically, only if you are an analyst developing your own product or working in outsourcing with a startup-oriented product from a client, and you are actively involved in generating its initial concept. That is, this is discovery / strategy analysis in the context of a building a product from scratch. I’ve used it much more often than the BMC, but not exactly in the form in which it was originally designed — we’ll talk about that below.
In my view and based on personal experience, the Business Model Canvas is not very often useful for an IT analyst. In some situations where the business model needs to be understood (for example, we have absolutely no clue how the client’s company operates and we need to study it to better understand the context for the target solution), it can make sense to fill it out together with the client to understand their organization. Similarly, if the stars align in such a way that we are implementing a product for a client that will significantly affect how the organization operates (for example, the organization will be built around that product), and we are the analysts allowed to actively participate at that level of strategy, then we can create a similar canvas for the TO BE situation as well.
The Lean Canvas in its original form is also not always useful for an analyst — specifically, only if you are an analyst developing your own product or working in outsourcing with a startup-oriented product from a client, and you are actively involved in generating its initial concept. That is, this is discovery / strategy analysis in the context of a building a product from scratch. I’ve used it much more often than the BMC, but not exactly in the form in which it was originally designed — we’ll talk about that below.
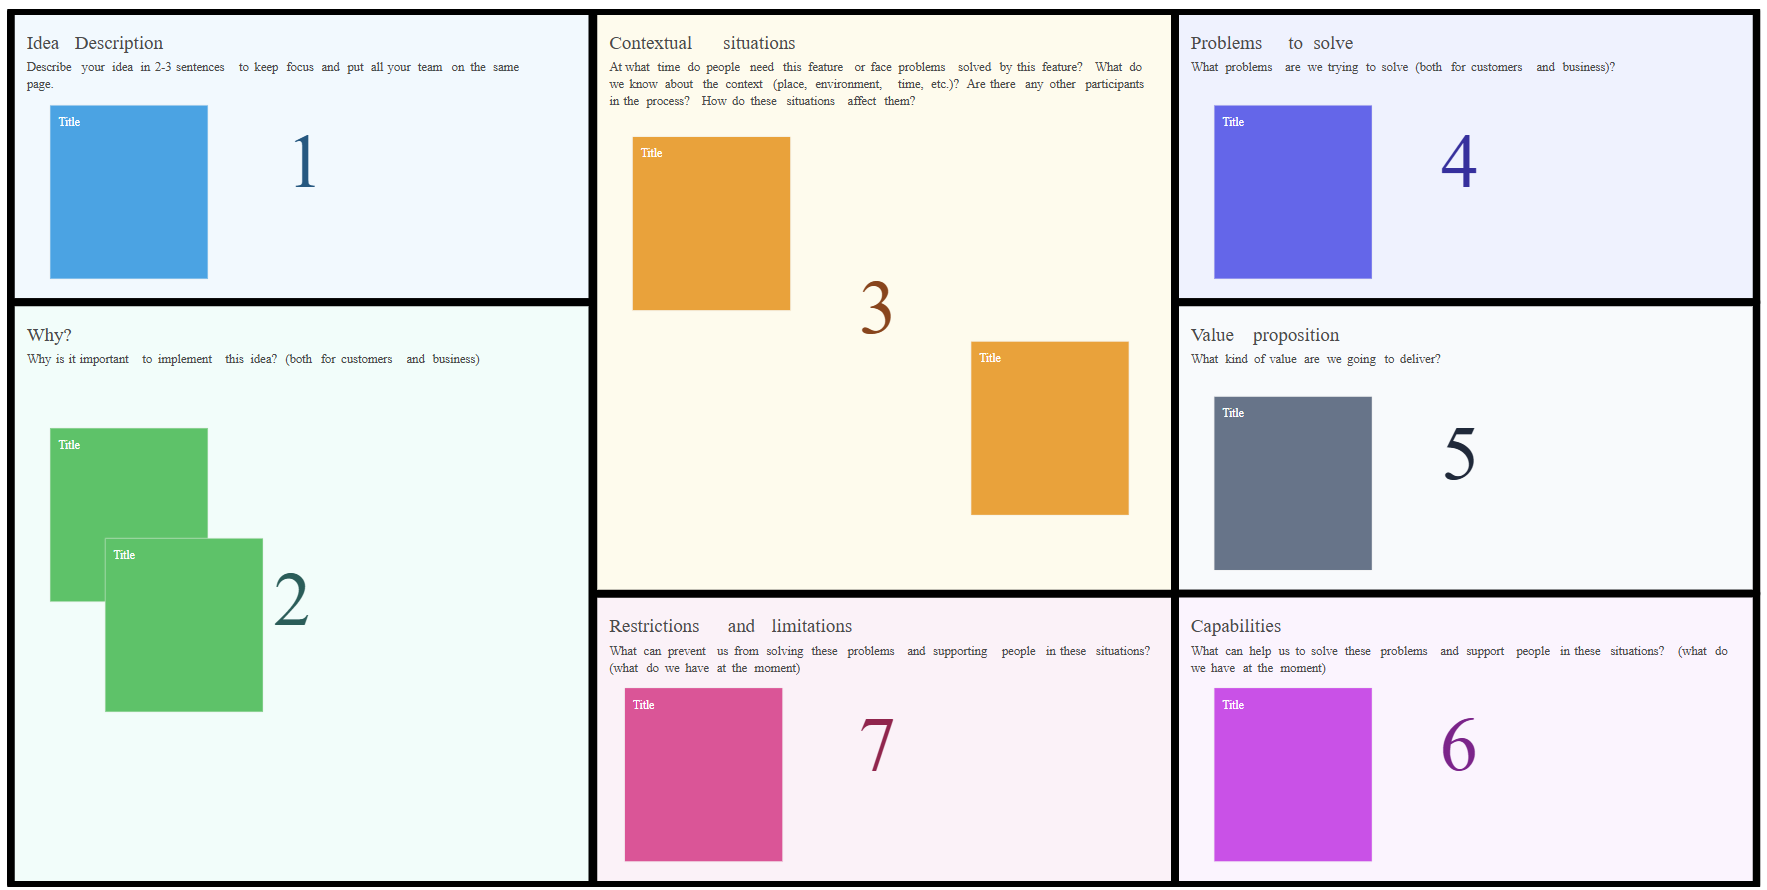
Canvas evolution didn’t stop with these two examples. Another one appeared: the Feature Canvas. A Feature Canvas is essentially a discussion of a product feature before it is developed.
There are many variations of the Feature Canvas, and here is one of them. All the sections in the template are fairly self-explanatory, so I won’t dwell on them in detail. Personally, I haven’t used this, because the tools I already had were sufficient for discussing features with stakeholders, but it’s useful to know that such a thing exists.
There are many variations of the Feature Canvas, and here is one of them. All the sections in the template are fairly self-explanatory, so I won’t dwell on them in detail. Personally, I haven’t used this, because the tools I already had were sufficient for discussing features with stakeholders, but it’s useful to know that such a thing exists.
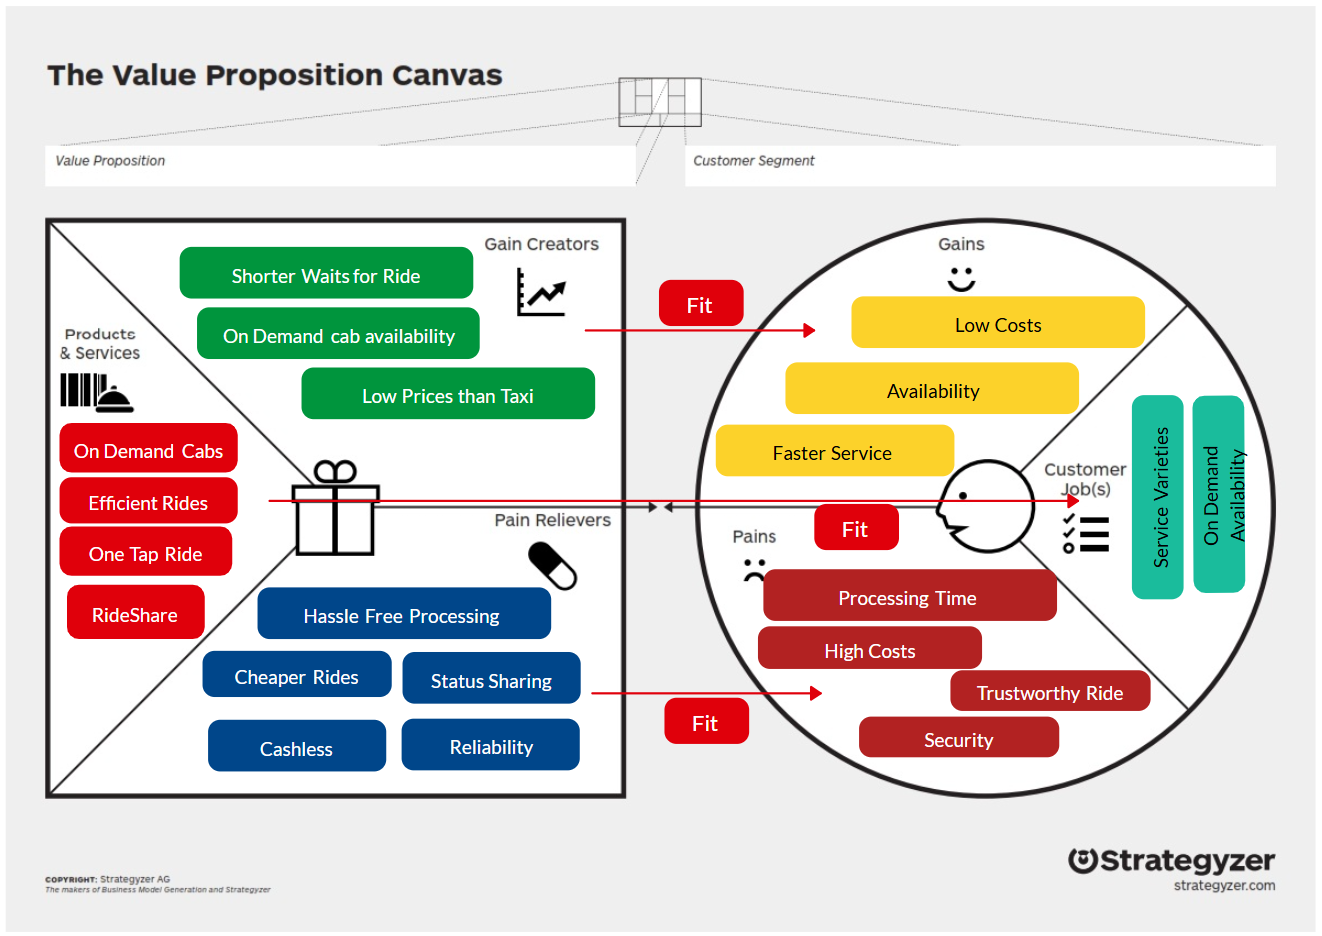
Apparently, Alexander Osterwalder liked canvases very much, so he and his co-authors later came up with the Value Proposition Canvas — a tool for more detailed work on the value proposition (one of the sections from the BMC).
The Value Proposition Canvas consists of two blocks: Customer Profile and Value Map. Customer Profile includes Jobs (what the person is trying to accomplish), Pains (what gets in the way), and Gains (what they want to achieve). The Value Map includes Products & Services (what we can offer), Pain Relievers (how we can reduce pain), and Gain Creators (how we create value for the customer).
Again, we won’t dive into details here. In my work, I’ve drawn something like this a couple of times, but mostly just for fun.
The Value Proposition Canvas consists of two blocks: Customer Profile and Value Map. Customer Profile includes Jobs (what the person is trying to accomplish), Pains (what gets in the way), and Gains (what they want to achieve). The Value Map includes Products & Services (what we can offer), Pain Relievers (how we can reduce pain), and Gain Creators (how we create value for the customer).
Again, we won’t dive into details here. In my work, I’ve drawn something like this a couple of times, but mostly just for fun.
Overall, canvases are a great technique, and I definitely recommend adding them to your toolkit. As I mentioned above, they should be viewed primarily as a conceptual way of working through information, and only secondarily as a checklist with a specific set of data. Canvases fit perfectly into the agile approach — that is, when we need to quickly and with minimal effort work through a certain set of information, and do it not in isolation but together with useful people.
So what do we do to make that happen?
So what do we do to make that happen?
1. We take an information elicitation technique that allows us to get the maximum result in the shortest possible time — a workshop, of course.
2. We gather everyone who has something to say on the topic. If we’re building strategic canvases, that includes the client/product owner, key stakeholders on their side (for example, representatives of target user groups), a technical lead from our side, and, depending on the situation, a PM, UX specialist, and other roles that are important at the moment. Just keep in mind that it’s important to have people representing different perspectives — technical, project, and business.
3. Given that any workshop requires a program (you usually can’t just say, “Guys, I gathered you here — talk to each other”) and proper facilitation, a canvas is a perfect fit — canvases already contain an embedded program: sequentially fill the sections with useful content. All you need is to organize the process correctly, and for that we follow these steps.
2. We gather everyone who has something to say on the topic. If we’re building strategic canvases, that includes the client/product owner, key stakeholders on their side (for example, representatives of target user groups), a technical lead from our side, and, depending on the situation, a PM, UX specialist, and other roles that are important at the moment. Just keep in mind that it’s important to have people representing different perspectives — technical, project, and business.
3. Given that any workshop requires a program (you usually can’t just say, “Guys, I gathered you here — talk to each other”) and proper facilitation, a canvas is a perfect fit — canvases already contain an embedded program: sequentially fill the sections with useful content. All you need is to organize the process correctly, and for that we follow these steps.
1) Preparation:
- Think through the order in which the canvas sections will be filled based on their meaning. The order shouldn’t be random: many sections are developed based on previous ones — for example, Problems first, and only then Solutions for each Problem.
- Prepare the canvas itself. This can be a physical board for in-person workshops or a board in Miro, FigJam, or similar tools.
- Prepare facilitation tools (physical or digital): in particular, a timer and voting mechanisms.
- Plan the duration (keep in mind that you shouldn’t exceed three hours for the entire workshop so you don’t overload participants — it’s better to split it into several sessions), participants, and other standard workshop parameters: location/tools for the session, breaks, recording, and so on.
During the workshop:
2) Communicate the goal of the event to everyone and what outcome we want to achieve, as well as the format and rules.
2) Communicate the goal of the event to everyone and what outcome we want to achieve, as well as the format and rules.
For each section:
3) Explain its meaning — what we expect from participants in terms of content — and provide guiding questions. It’s worth placing these questions directly on the board so participants always have them in front of their eyes. And do it in plain language: it’s one thing to say, “Here we fill in business needs,” but you’ll get much more from people if you frame it like, “What are the reasons for starting this project? What organizational problems are we solving with this project?”
4) Give participants time to put sticky notes on the board and set a timer for that. You decide how much time each section deserves. Just think in advance about how much cognitive effort each section will likely consume. On average, this is 5–15 minutes per section. Also communicate the rule: one idea — one sticky note.
5) When time is up, discuss what participants have posted: for example, the author explains the idea, while others comment. It is strongly recommended to timebox this as well so you don’t exceed the format — discussions can easily spiral out of control, and if you let them run free, you’ll be stuck there until night.
6) The analyst, acting as facilitator, removes duplicates and merges or decomposes ideas during the discussion — in general, tidies up the result so that only the necessary, well-structured content remains.
7) If necessary, vote — for example, when there are many ideas in a section. You can give participants a couple of magnets or sticky notes of a different color so they can place them on the ideas they particularly like. In digital formats, you can use likes or something similar.
8) A useful point that is often forgotten: immediately include one or more sections in the canvas for TBD / parking lot / action items. There will always be topics requiring additional discussion or research. For example, while discussing the pros and cons of a mobile application, you may realize that there isn’t enough evidence or that additional research is needed. To avoid getting bogged down in the moment, remember that the canvas is just a starting point. Detailed analysis or research (by the client, engineer, or analyst) should be taken outside the workshop scope, while clearly documenting who needs to do what.
After the workshop:
9) Save the canvas — take a photo or keep it in its original digital form and send it to all participants.
3) Explain its meaning — what we expect from participants in terms of content — and provide guiding questions. It’s worth placing these questions directly on the board so participants always have them in front of their eyes. And do it in plain language: it’s one thing to say, “Here we fill in business needs,” but you’ll get much more from people if you frame it like, “What are the reasons for starting this project? What organizational problems are we solving with this project?”
4) Give participants time to put sticky notes on the board and set a timer for that. You decide how much time each section deserves. Just think in advance about how much cognitive effort each section will likely consume. On average, this is 5–15 minutes per section. Also communicate the rule: one idea — one sticky note.
5) When time is up, discuss what participants have posted: for example, the author explains the idea, while others comment. It is strongly recommended to timebox this as well so you don’t exceed the format — discussions can easily spiral out of control, and if you let them run free, you’ll be stuck there until night.
6) The analyst, acting as facilitator, removes duplicates and merges or decomposes ideas during the discussion — in general, tidies up the result so that only the necessary, well-structured content remains.
7) If necessary, vote — for example, when there are many ideas in a section. You can give participants a couple of magnets or sticky notes of a different color so they can place them on the ideas they particularly like. In digital formats, you can use likes or something similar.
8) A useful point that is often forgotten: immediately include one or more sections in the canvas for TBD / parking lot / action items. There will always be topics requiring additional discussion or research. For example, while discussing the pros and cons of a mobile application, you may realize that there isn’t enough evidence or that additional research is needed. To avoid getting bogged down in the moment, remember that the canvas is just a starting point. Detailed analysis or research (by the client, engineer, or analyst) should be taken outside the workshop scope, while clearly documenting who needs to do what.
After the workshop:
9) Save the canvas — take a photo or keep it in its original digital form and send it to all participants.
Like any workshop, filling out canvases requires several things:
Why these canvases are so powerful as a technique:
What to keep in mind:
Canvases provide a high-level understanding. This follows logically from the format itself: if you compare an analyst’s deep dive into a topic over a couple of weeks (with careful stakeholder selection and thoughtful post-analysis after each conversation) to a workshop with strict time limits for each section, it’s obvious that something has to be sacrificed. And that’s where it’s important to understand that this is only a starting point — you will refine the necessary elements later if needed, even through a series of individual interviews and additional research.
- As noted above, preparation and careful facilitation are important during the process. In general, a workshop is a powerful information elicitation technique, but it is usually quite energy-intensive and requires skills in managing group dynamics. So set aside a morning for it and show up energized.
- It requires (unsurprisingly) the presence and active participation of stakeholders. Without that, the magic won’t happen. That’s why we say this technique works so well within the agile paradigm — agile without active involvement from the client (or at least a legitimate product owner) is difficult to get off the ground.
Why these canvases are so powerful as a technique:
- A fast and efficient way to work through the necessary set of information. We bring the right people together and generate a large amount of useful content while discussing it along the way.
- Visual nature. This is not a long document produced by an analyst after a series of interviews, but a visual (and even aesthetically pleasing, if you have a sense of beauty) picture. Don’t underestimate the power of that — both for clients and for your team.
- It’s collaborative work, part of which we shift onto the client and other stakeholders. In other words, we don’t write the document alone — we let others contribute to the artifact. This approach increases engagement and ownership because people formulate the ideas themselves.
- It’s interesting. Participants stick notes, place magnets, and generally take part in something engaging.
- The canvas can later be printed and placed somewhere within easy reach as a one-page poster.
- The canvas is easy to change (at least in the digital version) as hypotheses are tested and context evolves (for example, when business ideas change).
What to keep in mind:
Canvases provide a high-level understanding. This follows logically from the format itself: if you compare an analyst’s deep dive into a topic over a couple of weeks (with careful stakeholder selection and thoughtful post-analysis after each conversation) to a workshop with strict time limits for each section, it’s obvious that something has to be sacrificed. And that’s where it’s important to understand that this is only a starting point — you will refine the necessary elements later if needed, even through a series of individual interviews and additional research.
Given that the canvases discussed above are useful in relatively narrow situations, in my practice I more often use something that can be provisionally called a Discovery Canvas. I actually just named it that for the purpose of this article — in reality, I usually say that it’s a variation of Lean Canvas. This is when you need to conduct a quick and efficient strategy analysis not only for startup products. There is nothing unusual about it — it simply consists of sections from the classic Vision and Scope document, filtered or supplemented depending on the specifics of the project (you might want to read this first: Strategy Analysis, Discovery, and Vision and Scope — Demystified).
Here is what it might look like and in what order it can be filled. I’ll just note again that this is only an example — in practice, you need to think carefully about which sections and their order are relevant depending on your involvement in the project and which questions are appropriate to discuss.
Here is what it might look like and in what order it can be filled. I’ll just note again that this is only an example — in practice, you need to think carefully about which sections and their order are relevant depending on your involvement in the project and which questions are appropriate to discuss.
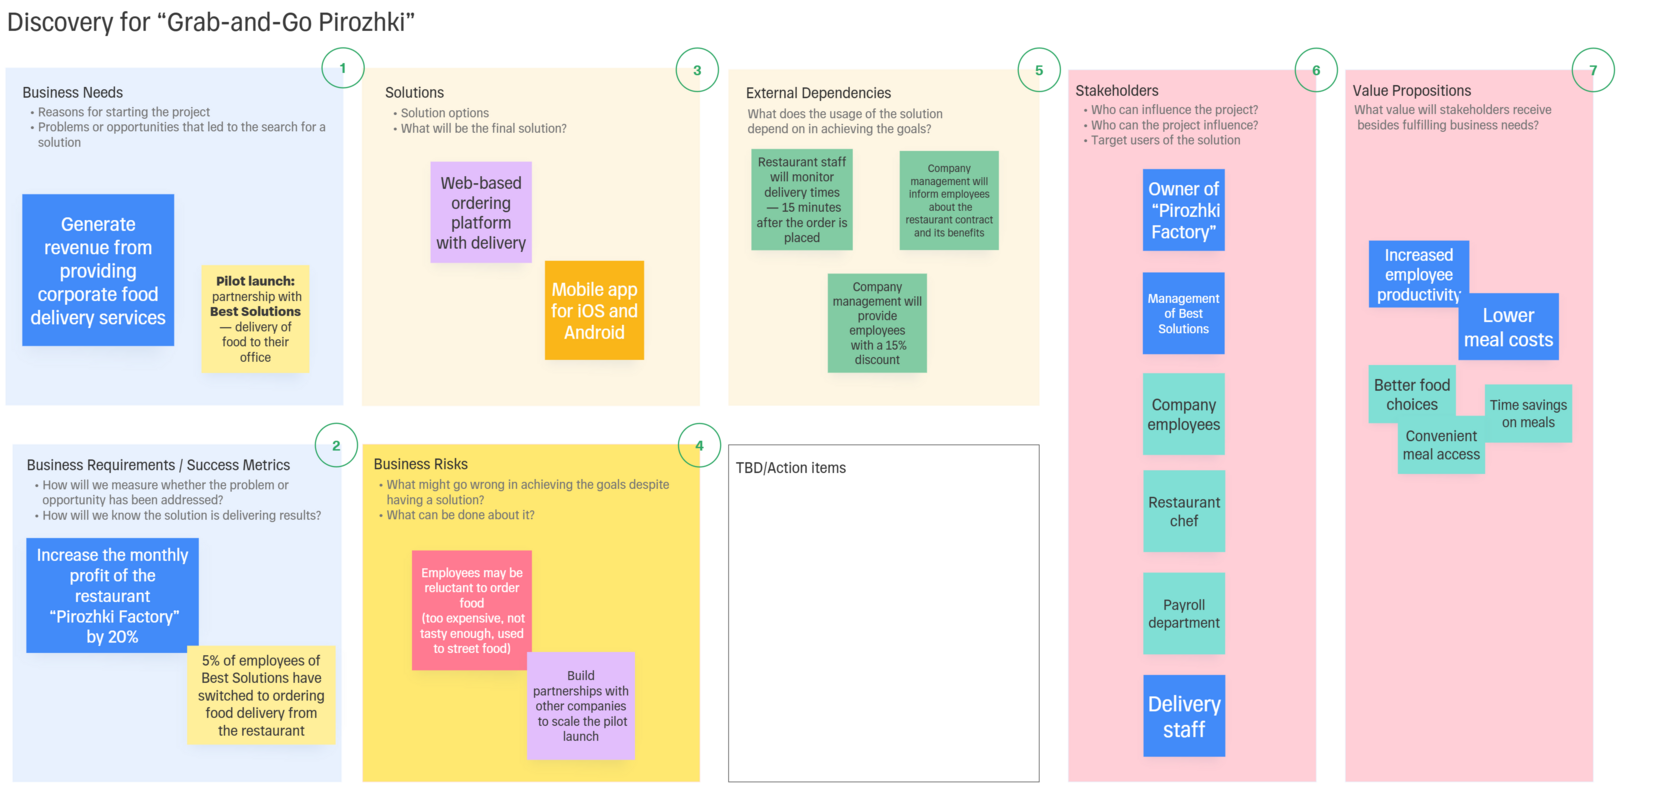
- Business Needs — business needs (problems or opportunities that the organization/client wants to address). You can also add context (symptoms, AS IS metrics, affected processes).
- Business Requirements / Success Metrics — business requirements derived from business needs. Optionally: success criteria for the solution (what indicators over time will show that the solution helps achieve the business requirements).
- Solutions — solution options for achieving business requirements. Here you need to discuss their pros and cons and agree on the final solution.
- Business Risks — what might go wrong in achieving business requirements, even with a ready and working solution. If appropriate, also discuss policies for handling them.
- External Dependencies — what external factors does the successful functioning of the solution depend on in terms of achieving business requirements?
- Stakeholders — stakeholders related to the business requirements or the solution. You can also add their roles with respect to the solution, since that will be our focus.
- Value Propositions — the value stakeholders will receive from the solution (if they receive any).
So this is a template for classic strategy analysis, but filled out in a workshop format inspired by well-known canvases.
What is not included here in the context of discovery / strategic analysis is scope (solution boundaries). And that’s intentional — scope is not something that works particularly well in the workshop format described above. There are separate techniques for scope that can perfectly complement the canvas in subsequent sessions: Impact Map and User Story Map: How to Tackle the Scope Fast and Hard (Part 1 and Part 2).
What is not included here in the context of discovery / strategic analysis is scope (solution boundaries). And that’s intentional — scope is not something that works particularly well in the workshop format described above. There are separate techniques for scope that can perfectly complement the canvas in subsequent sessions: Impact Map and User Story Map: How to Tackle the Scope Fast and Hard (Part 1 and Part 2).